So! The time has come once again to rework the blog. I'll be doing a lot more writing in a couple of different places.
First off, for what I'll be working on professionally, head on over to this Cthonic Studios Post where I outline several of the TTRPG and Software projects I'll be doing in 2024 (I'm super excited about all of this).
Cthonicstudios.com is where I'll be doing all of my "professional" blogging, complete with musings on all the philosophy of TTRPG stuff I've been thinking... Read More
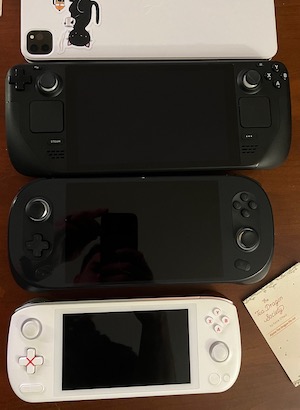
tl;dr - If you're most people, get a Steam Deck. If you've got similar use cases to me Ayaneo 2 might be for you.
I don't think I've ever posted about this before, but I wanted to take a bit of time to talk about one of my pretty-obvious hobbies. Despite having way too many side projects, and working too many hours in the week, I still like to try and find some time to play video games.
After working 50-60 hours a week, I like to unwind - but I don't really have a great place to play console... Read More
Just a quick note for the blog that I've added a self-hosted copy of Plausible analytics. Privacy friendly, only going to me to understand visitor statistics.
Installation was simple, and I'll keep y'all apprised on how well it goes. Read More
So I've added 3 new earbuds to my Earbuds Review Page: Anker Soundcore Space A40, Anker Soundcore VR P10, and Apple Airpods Pro v2.
I've finally also written the write-ups for the other buds on the list that were missing. Hope the info in there is useful for you. As always, the thoughts in there are my opinions, and they're all super subjective so your mileage may vary. Read More
I've fallen down a super deep Fediverse rabbit hole. It feels kinda like for the first time I can play around with stuff and not have my Extra Life videos just living on Twitch or Youtube. As a result, I've put up my own PeerTube instance up on vid.cthos.dev and am slowly moving the Extra Life videos there. They're going to stay up on Youtube as well, but here's a much better place to move things. Going to see if I can also make copies of my old talks, but odds are good I don't have the rights... Read More
So thanks to the RSS Plugin for 11ty I now have these posts available via RSS! The feed is linked in the footer and is available at /feed.xml.
I intend to do the same thing to the reviews page just as soon as I finish up my headphone reviews page. Which I'll definitely do, one of these days.... Read More
 tl;dr - If you're most people, get a Steam Deck. If you've got similar use cases to me Ayaneo 2 might be for you.